West Bank
Background
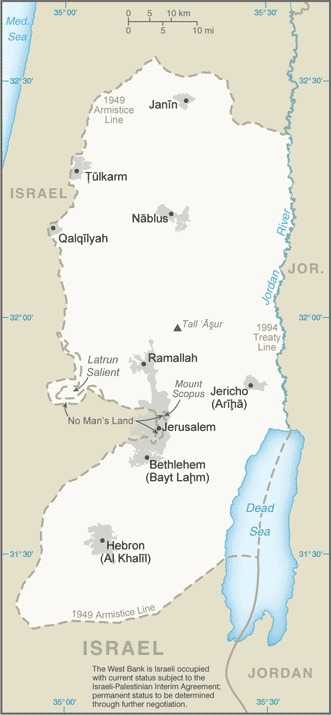
The landlocked West Bank -- the larger of the two Palestinian territories -- is home to some three million Palestinians. Inhabited since at least the 15th century B.C., the area currently known as the West Bank has been dominated by a succession of differentpowers. In the early 16th century, it was incorporated into the Ottoman Empire. The West Bank fell to British forces during World War I, becoming part of the British Mandate of Palestine. After the 1948 Arab-Israeli War, Transjordan (later renamed Jordan) captured the West Bank and annexed it in 1950; Israel then captured it in the Six-Day War in 1967. Under the Oslo Accords -- a series of agreements that were signed between 1993 and 1999 -- Israel transferred to the newly created Palestinian Authority (PA) security and civilian responsibility for the many Palestinian-populated areas of the West Bank, as well as the Gaza Strip.
In addition to establishing the PA as an interim government, the Oslo Accords divided the West Bank into three areas, with one fully managed by the PA (Area A), another fully managed by Israel (Area C), and a third with shared control (Area B) until a permanent agreement could be reached between the Palestine Liberation Organization (PLO) and Israel. In 2000, a violent intifada, or uprising, began across the Palestinian territories,and in 2001, negotiations for a permanent agreement between the PLO and Israel on final status issues stalled. Subsequent attempts to re-start direct negotiations have not resulted in progress toward determining final status of the area.
The PA last held national elections in 2006, when the Islamic Resistance Movement (HAMAS) won a majority of seats in the Palestinian Legislative Council (PLC). Fatah, the dominant Palestinian political faction in the West Bank, and HAMAS failed to maintain a unity government, leading to violent clashes between their respective supporters and to HAMAS's violent seizure of all PA military and governmental institutions in the Gaza Strip in 2007. In 2018, the Palestinian Constitutional Court dissolved the PLC. In recent years, Fatah and HAMAS have made several attempts at reconciliation, but the factions have been unable to implement agreements.
Geographic coordinates
Natural hazards
Area - comparative
Environmental issues
Climate
Coastline
Land boundaries
Border countries (2): Israel 330 km; Jordan 148 km
Land use
Arable land: 7% (2023 est.)
Permanent crops: 11.8% (2023 est.)
Permanent pasture: 46.1% (2023 est.)
Forest: 1.8% (2023 est.)
Other: 32.1% (2023 est.)
Note: Includes Gaza Strip
Maritime claims
Natural resources
Geography - note
Terrain
Location
Map references
Irrigated land
Population distribution
Elevation
Lowest point: Dead Sea -431 m
Total renewable water resources
Note: Data represent combined total from the Gaza Strip and the West Bank.
Major lakes (area sq km)
Note - endorheic hypersaline lake; 9.6 times saltier than the ocean; lake shore is 431 meters below sea level
Area
Land: 5,640 sq km
Water: 220 sq km
Note: Includes West Bank, Latrun Salient, and the northwest quarter of the Dead Sea, but excludes Mt. Scopus; East Jerusalem and Jerusalem No Man's Land are also included only as a means of depicting the entire area occupied by Israel in 1967
Age structure
15-64 years: 59.5% (male 979,719/female 949,746)
65 years and over: 3.9% (2024 est.) (male 59,234/female 65,946)
Sex ratio
0-14 years: 1.05 male(s)/female
15-64 years: 1.03 male(s)/female
65 years and over: 0.9 male(s)/female
Total population: 1.03 male(s)/female (2024 est.)
Literacy
Male: 99% (2022 est.)
Female: 97% (2022 est.)
Note: Estimates are for Gaza and the West Bank
School life expectancy (primary to tertiary education)
Male: 12 years (2023 est.)
Female: 14 years (2023 est.)
Note: Data represent Gaza Strip and the West Bank
Urbanization
Rate of urbanization: 2.85% annual rate of change (2020-25 est.)
Note: Data represent Gaza Strip and the West Bank
Drinking water source
Urban: 98% of population (2022 est.)
Rural: 100% of population (2022 est.)
Total: 98.4% of population (2022 est.)
Unimproved:
Urban: 2% of population (2022 est.)
Total: 1.6% of population (2022 est.)
Note: Includes Gaza Strip and the West Bank
Physician density
Hospital bed density
Dependency ratios
Youth dependency ratio: 61.6 (2024 est.)
Elderly dependency ratio: 6.5 (2024 est.)
Potential support ratio: 15.4 (2024 est.)
Sanitation facility access
Urban: 100% of population (2022 est.)
Rural: 99% of population (2022 est.)
Total: 99.8% of population (2022 est.)
Unimproved:
Urban: 0% of population (2022 est.)
Rural: 1% of population (2022 est.)
Total: 0.2% of population (2022 est.)
Note: Includes Gaza Strip and the West Bank
Ethnic groups
Religions
Languages
Major-language sample(s):
كتاب حقائق العالم، المصدر الذي لا يمكن الاستغناء عنه للمعلومات الأساسية (Arabic)
The World Factbook, the indispensable source for basic information.
Health expenditure
Note: Includes Gaza Strip and the West Bank
Child marriage
Women married by age 18: 13.4% (2020)
Note: Includes both the Gaza Strip and the West Bank
Gross reproduction rate
Currently married women (ages 15-49)
Note: Data includes Gaza and the West Bank
Youth unemployment rate (ages 15-24)
Male: 31.6% (2022 est.)
Female: 56.6% (2022 est.)
note: % of labor force ages 15-24 seeking employment
Net migration rate
Median age
Male: 21.6 years
Female: 22.1 years
Maternal mortality ratio
Note: Data represent Gaza Strip and the West Bank
Total fertility rate
Population
Male: 1,648,450
Female: 1,594,919
Note: Approximately 468,300 Israeli settlers live in the West Bank (2022); approximately 236,600 Israeli settlers live in East Jerusalem (2021)
Infant mortality rate
Male: 17.5 deaths/1,000 live births
Female: 12.6 deaths/1,000 live births
Death rate
Birth rate
Children under the age of 5 years underweight
Note: Estimate is for Gaza Strip and the West Bank
Life expectancy at birth
Male: 74.4 years
Female: 78.8 years
Education expenditure
Note: Includes Gaza Strip and the West Bank
Population growth rate
Total water withdrawal
Industrial: 37 million cubic meters (2022)
Agricultural: 158 million cubic meters (2022)
Note: Data represent combined total from the Gaza Strip and the West Bank.
Waste and recycling
Note: Data represent combined total from the Gaza Strip and the West Bank.
Particulate matter emissions
Carbon dioxide emissions
From petroleum and other liquids: 3.913 million metric tonnes of CO2 (2023 est.)
Note: Includes the West Bank and the Gaza Strip
Energy consumption per capita
Note: Includes the West Bank and the Gaza Strip
Country name
Conventional short form: West Bank
Etymology: Name refers to the location of the British Mandate of Palestine that was occupied and administered by Jordan in 1948, on the west bank of the Jordan River; the designation was retained after the 1967 Six-Day War and subsequent changes in administration
National heritage
Selected World Heritage Site locales: Ancient Jericho/Tell es-Sultan; Birthplace of Jesus: Church of the Nativity and the Pilgrimage Route, Bethlehem; Hebron/Al-Khalil Old Town; Land of Olives and Vines – Cultural Landscape of Southern Jerusalem, Battir
Population below poverty line
note: % of population with income below national poverty line; entry includes West Bank and Gaza Strip
Household income or consumption by percentage share
Highest 10%: 27.1% (2023 est.)
note: % share of income accruing to lowest and highest 10% of population; entry includes West Bank and Gaza Strip
Exports - commodities
note: top five export commodities based on value in dollars; entry includes the West Bank and the Gaza Strip
Agricultural products
Budget
Expenditures: $1.499 billion (2021 est.)
note: central government revenues and expenditures (excluding grants and social security funds) converted to US dollars at average official exchange rate for year indicated
Imports - commodities
note: top five import commodities based on value in dollars; entry includes the West Bank and the Gaza Strip
Exchange rates
Exchange rates:
3.7 (2024 est.)
3.67 (2023 est.)
3.36 (2022 est.)
3.23 (2021 est.)
3.442 (2020 est.)
Industries
GDP (official exchange rate)
note: data in current dollars at official exchange rate; entry includes West Bank and Gaza Strip
GDP - composition, by end use
Government consumption: 20.7% (2024 est.)
Investment in fixed capital: 24.7% (2023 est.)
Investment in inventories: 1.7% (2024 est.)
Exports of goods and services: 21% (2024 est.)
Imports of goods and services: -60.3% (2024 est.)
note: figures may not total 100% due to rounding or gaps in data collection
Remittances
18.2% of GDP (2023 est.)
24% of GDP (2022 est.)
note: personal transfers and compensation between resident and non-resident individuals/households/entities; entry includes West Bank and Gaza Strip
Exports - partners
note: top five export partners based on percentage share of exports; entry includes the West Bank and the Gaza Strip
Imports - partners
note: top five import partners based on percentage share of imports; entry includes the West Bank and the Gaza Strip
Labor force
note: number of people ages 15 or older who are employed or seeking work; entry includes West Bank and Gaza Strip
Reserves of foreign exchange and gold
$1.323 billion (2023 est.)
$896.9 million (2022 est.)
note: holdings of gold (year-end prices)/foreign exchange/special drawing rights in current dollars; entry includes West Bank and Gaza Strip
Unemployment rate
26.4% (2021 est.)
25.9% (2020 est.)
note: % of labor force seeking employment; entry includes West Bank and Gaza Strip
Taxes and other revenues
note: central government tax revenue as a % of GDP; entry includes West Bank and Gaza Strip
Real GDP (purchasing power parity)
$27.694 billion (2023 est.)
$29.016 billion (2022 est.)
note: data in 2021 dollars; entry includes West Bank and Gaza Strip
Inflation rate (consumer prices)
5.9% (2023 est.)
3.7% (2022 est.)
note: annual % change based on consumer prices; entry includes West Bank and Gaza Strip
Current account balance
-$2.895 billion (2023 est.)
-$2.037 billion (2022 est.)
note: balance of payments - net trade and primary/secondary income in current dollars; entry includes West Bank and Gaza Strip
Real GDP per capita
$5,400 (2023 est.)
$5,800 (2022 est.)
note: data in 2021 dollars; entry includes West Bank and Gaza Strip
Imports
$11.637 billion (2023 est.)
$12.257 billion (2022 est.)
Note: Balance of payments - imports of goods and services in current dollars; entry includes West Bank and Gaza Strip
Exports
$3.413 billion (2023 est.)
$3.533 billion (2022 est.)
note: balance of payments - exports of goods and services in current dollars; entry includes West Bank and Gaza Strip
Real GDP growth rate
-4.6% (2023 est.)
4.1% (2022 est.)
note: annual GDP % growth based on constant local currency; entry includes West Bank and Gaza Strip
Industrial production growth rate
note: annual % change in industrial value added based on constant local currency; entry includes West Bank and Gaza Strip
GDP - composition, by sector of origin
Industry: 17.4% (2022 est.)
Services: 58.3% (2022 est.)
note: figures may not total 100% due to non-allocated consumption not captured in sector-reported data
Electricity access
Note: Includes the West Bank and the Gaza Strip
Electricity generation sources
Solar: 33.5% of total installed capacity (2023 est.)
Note: Includes the West Bank and the Gaza Strip
Petroleum
Note: Includes the West Bank and the Gaza Strip
Coal
Note: Includes the West Bank and the Gaza Strip
Electricity
Consumption: 6.956 billion kWh (2023 est.)
Imports: 6.925 billion kWh (2023 est.)
Transmission/distribution losses: 988 million kWh (2023 est.)
Note: Includes the West Bank and the Gaza Strip
Internet users
Note: Includes the Gaza Strip
Internet country code
Note: IANA has designated .ps for the West Bank, same as Gaza Strip
Broadcast media
Telephones - mobile cellular
Subscriptions per 100 inhabitants: 78 (2021 est.)
note: entry includes the West Bank and the Gaza Strip
Broadband - fixed subscriptions
Subscriptions per 100 inhabitants: 8 (2023 est.)
Note: Includes the Gaza Strip
Telephones - fixed lines
Subscriptions per 100 inhabitants: 7 (2023 est.)
note: entry includes the West Bank and the Gaza Strip
Airports
Heliports
Military and security forces
Note: The National Security Forces conduct gendarmerie-style security operations in circumstances that exceed the capabilities of the Civil Police; it is the largest branch of the PA security services and acts as the internal Palestinian security force; the Presidential Guard protects facilities and provides dignitary protection; the Preventive Security Organization is responsible for internal intelligence gathering and investigations related to internal security cases, including political dissent
Military expenditures
Military - note
Military and security service personnel strengths
Refugees and internally displaced persons
Terrorist group(s)
Note: Details about the history, aims, leadership, organization, areas of operation, tactics, targets, weapons, size, and sources of support of the group(s) appear(s) in the Terrorism reference guide
Gini Index coefficient - distribution of family income
note: index (0-100) of income distribution; higher values represent greater inequality; entry includes West Bank and Gaza Strip